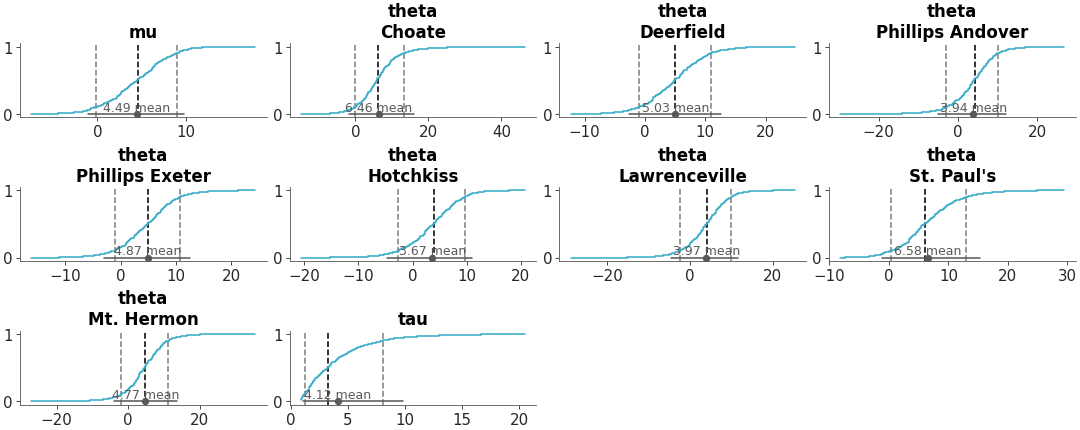
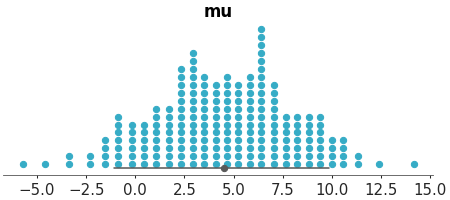
Posterior quantile dot plots#
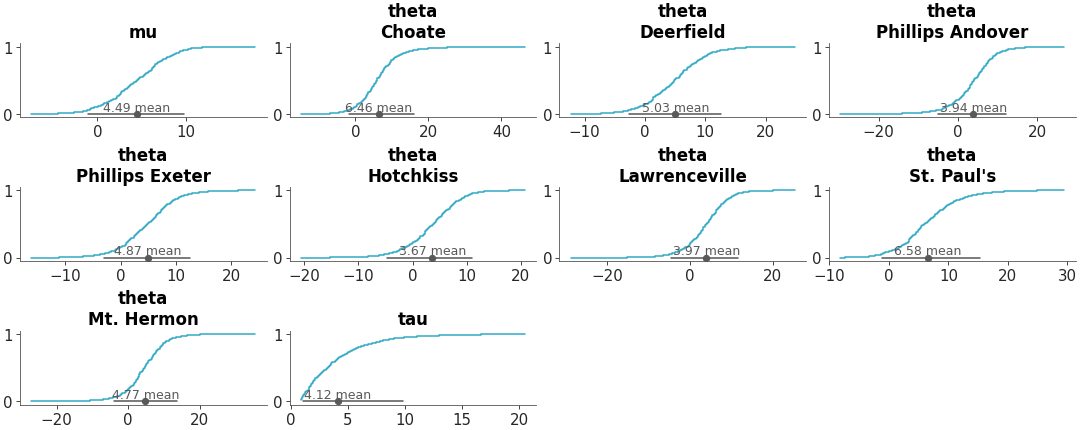
Quantile dot plot of the variable mu from the centered eight model. We have removed the point estimate text
and changed the number of quantiles to 200.
from arviz_base import load_arviz_data

import arviz_plots as azp

azp.style.use("arviz-variat")

data = load_arviz_data("centered_eight")
pc = azp.plot_dist(
    data,
    kind="dot",
    var_names=["mu"],
    visuals={"point_estimate_text": False},
    stats={"dist":{"nquantiles":200}},
    backend="none"  # change to preferred backend
)
pc.show()
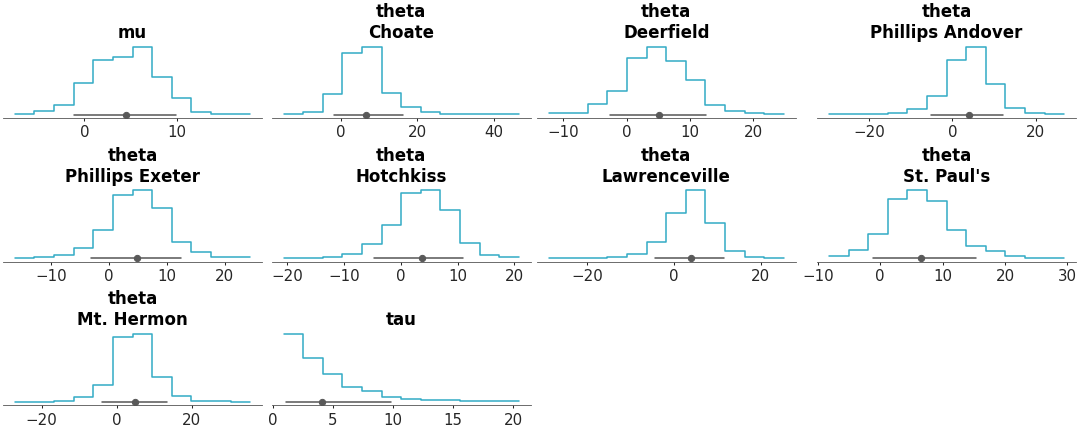
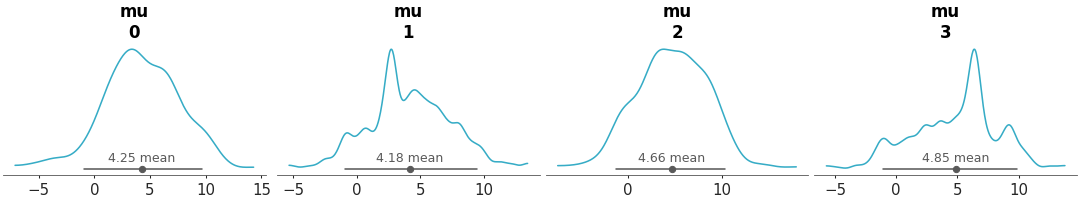
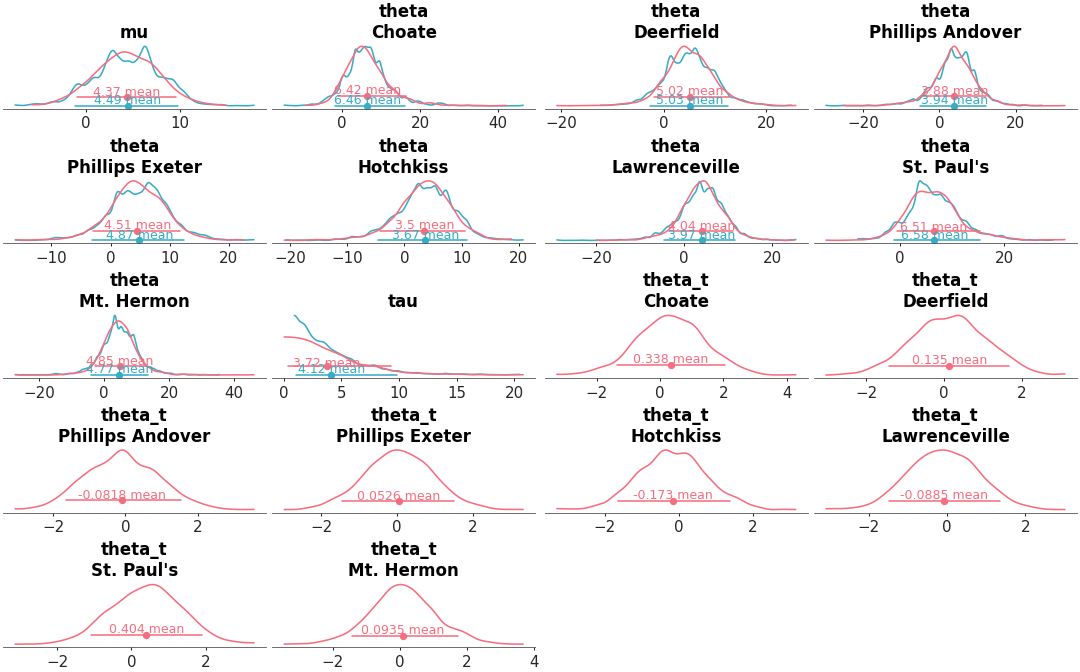
Other examples with plot_dist#